Introduction
The largest ever independent Telomere Analysis study was carried out by Medizen Humancare Co. Ltd., who provide genetic diseases risk analysis services through genomic testing.
The clinical trial took place from early 2021 to early 2022 with more than 200 people aged from 44 to 75 years taking part. Test subjects underwent Telomere Analysis to measure their telomere length before starting the trial and again after completing 1-2 bottles of Bill Andrews Aging Care Capsules – taking 2-4 capsules per day. For most the test period was around 45 days.
Over 90% of people experienced a positive benefit, with their telomere length increased and biological age reduced often significantly. These case studies show the remarkable effects of taking our capsules, in particular for the elderly whose telomeres are closer to critically short lengths.
Defytime is the only company publishing test results of people using and taking supplements containing the telomerase inducing activator TAM. As this was an independent study, Defytime is not permitted to access or publish the full 200 plus results of the study. Below we have shown a sample of 32 tests from the trial.
About Chronological vs Biological Aging
Your chronological age is the amount of time in terms of years, months, days, etc that has passed from your birth to a given date. This is the primary way people define their age.
Your biological age depends on a number of variables that can change on a continuing basis including genetics, lifestyle, nutrition, diseases and other conditions. Using these guidelines, medical professionals can figure out what age your body ‘acts’ like it is. The difference between the two can be surprising.
Telomere Analysis Technology
Telomere analysis is done by saliva test and measures telomere length in order to accurately evaluate the body’s biological age. The TAT (Telomere Analysis Technology) test is a biomarker that enables risk assessment and early prognosis of various diseases including cancer, by comprehensively analysing, and appropriately evaluating telomere length that is a factor of age-related diseases.
Disclaimer
- No Guarantee of Results: Defytime makes no guarantees with regard to the amount of telomere length increase or health benefit a client may achieve.
- Results will vary depending on the health condition and lifestyle of each individual.
- Further information about the people who were tested is confidential to protect their privacy.
- The information and graphical diagrams presented are copyrighted to Defytime Limited.
Female aged 70 years:
Test results before and after approx. 45 days show short telomere length increased by 30.36% and estimated biological age now 10 years younger.
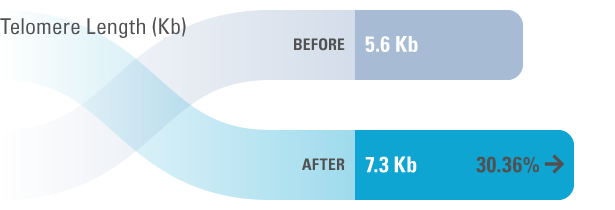
The 20th percentile indicates the telomere length below which 20% of the observed telomeres fall. As such it is an estimator of the percentage of short telomeres in the cells.
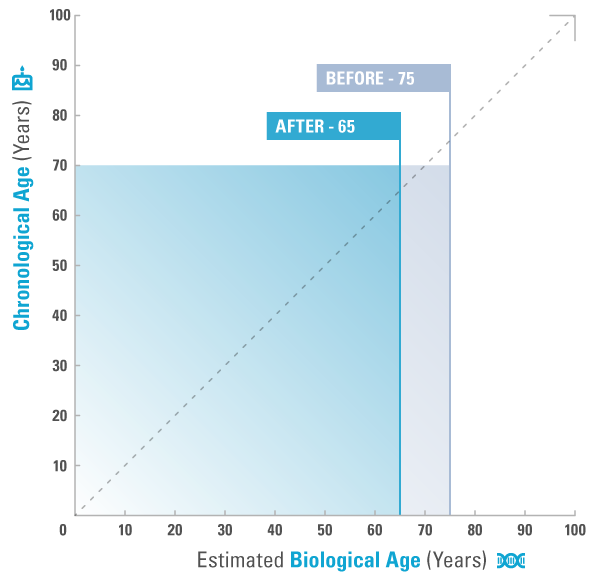
| TAT Test | Chronological Age | Sex | Estimated Biological Age | Difference with Chronological Age | Difference with last test | Median | 20th Percentile |
|---|---|---|---|---|---|---|---|
| Before | 70 | Female | 75 | +5 | – | 5.6Kb | |
| After | 70 | 65 | -5 | 10 years younger | – | 7.3Kb |
Female aged 75 years:
Test results before and after approx. 45 days show short telomere length increased by 25% and estimated biological age now 10 years younger.
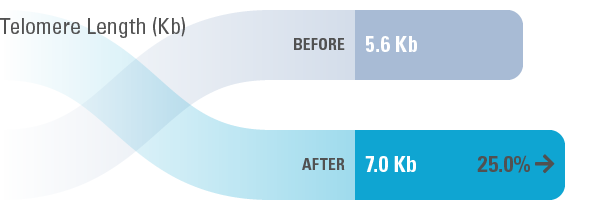
The 20th percentile indicates the telomere length below which 20% of the observed telomeres fall. As such it is an estimator of the percentage of short telomeres in the cells.
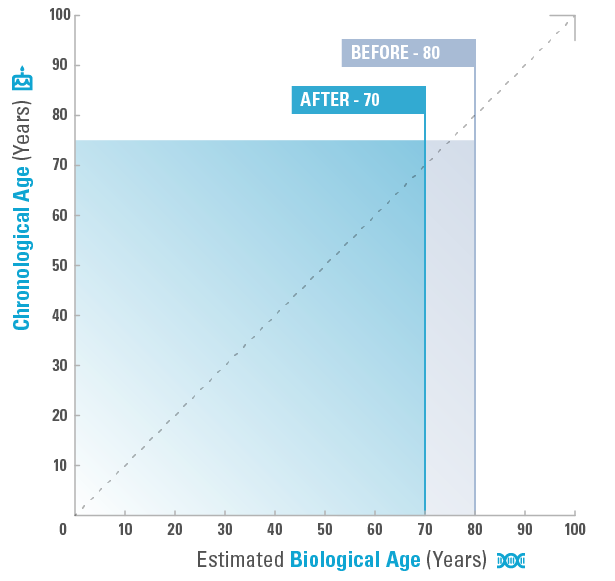
| TAT Test | Chronological Age | Sex | Estimated Biological Age | Difference with Chronological Age | Difference with last test | Median | 20th Percentile |
|---|---|---|---|---|---|---|---|
| Before | 75 | Female | 80 | +5 | – | 5.6Kb | |
| After | 75 | 70 | -5 | 10 years younger | – | 7.0Kb |
Male aged 62 years:
Test results before and after approx. 45 days show short telomere length increased by 43.5% and estimated biological age now 10 years younger.
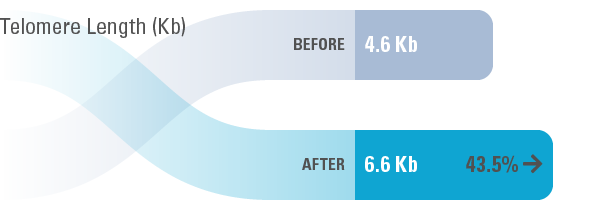
The 20th percentile indicates the telomere length below which 20% of the observed telomeres fall. As such it is an estimator of the percentage of short telomeres in the cells.
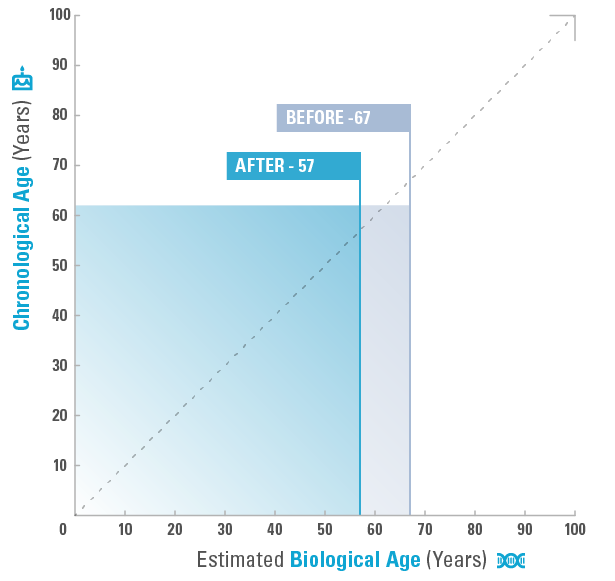
| TAT Test | Chronological Age | Sex | Estimated Biological Age | Difference with Chronological Age | Difference with last test | Median | 20th Percentile |
|---|---|---|---|---|---|---|---|
| Before | 62 | Male | 67 | +5 | – | 4.6Kb | |
| After | 62 | 57 | -5 | 10 years younger | – | 6.6Kb |
Female aged 72 years:
Test results before and after approx. 45 days show short telomere length increased by 28.6% and estimated biological age now 10 years younger.
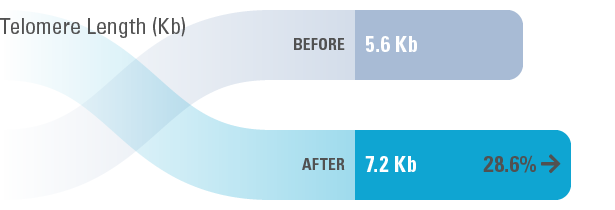
The 20th percentile indicates the telomere length below which 20% of the observed telomeres fall. As such it is an estimator of the percentage of short telomeres in the cells.
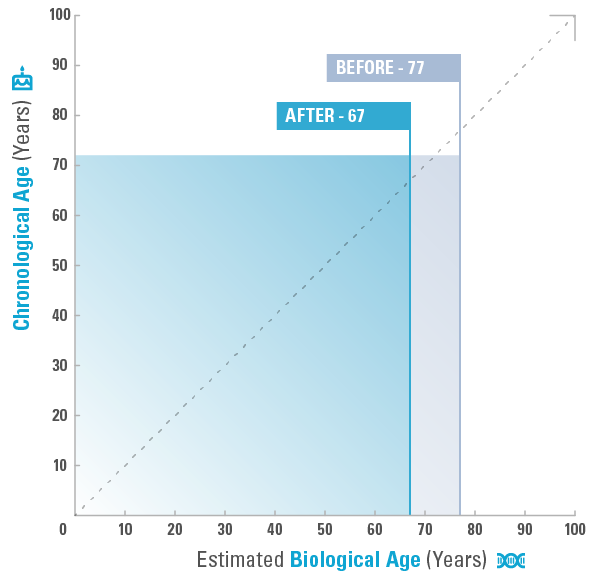
| TAT Test | Chronological Age | Sex | Estimated Biological Age | Difference with Chronological Age | Difference with last test | Median | 20th Percentile |
|---|---|---|---|---|---|---|---|
| Before | 72 | Female | 77 | +5 | – | 5.6Kb | |
| After | 72 | 67 | -5 | 10 years younger | – | 7.2Kb |
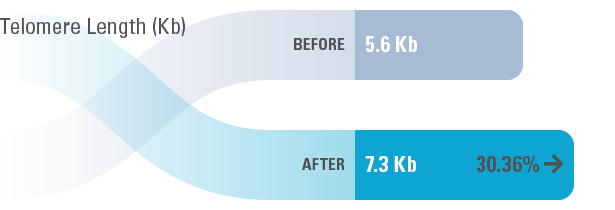
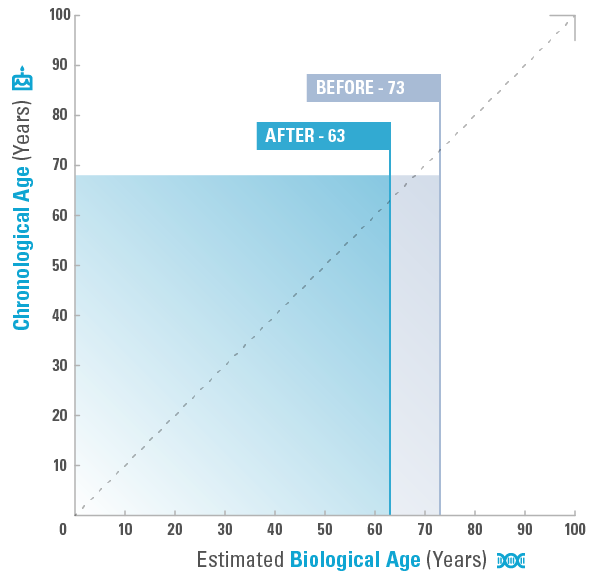
Female aged 68 years:
Test results before and after approx. 45 days show short telomere length increased by 30.36% and estimated biological age now 10 years younger.
The 20th percentile indicates the telomere length below which 20% of the observed telomeres fall. As such it is an estimator of the percentage of short telomeres in the cells.
| TAT Test | Chronological Age | Sex | Estimated Biological Age | Difference with Chronological Age | Difference with last test | Median | 20th Percentile |
|---|---|---|---|---|---|---|---|
| Before | 68 | Female | 73 | +5 | – | 5.6Kb | |
| After | 68 | 63 | -5 | 10 years younger | – | 7.3Kb |
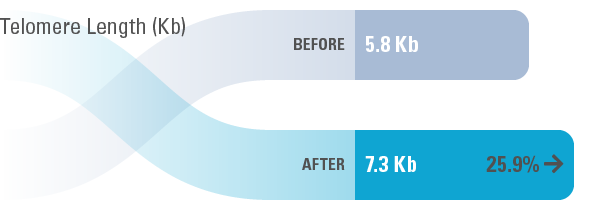
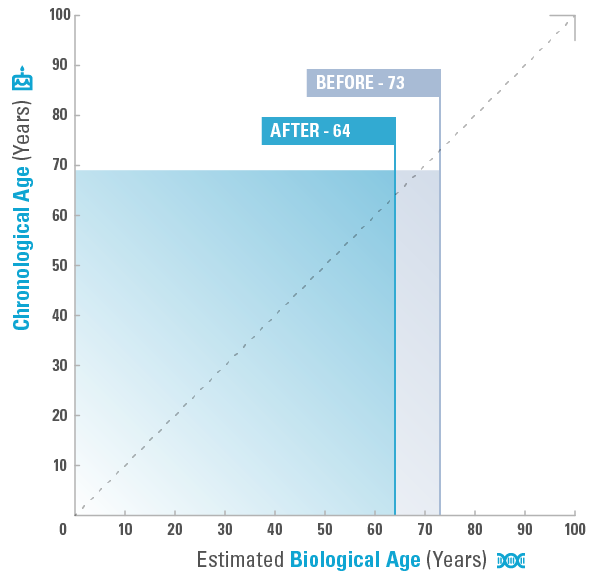
Female aged 69 years:
Test results before and after approx. 45 days show short telomere length increased by 25.9% and estimated biological age now 9 years younger.
The 20th percentile indicates the telomere length below which 20% of the observed telomeres fall. As such it is an estimator of the percentage of short telomeres in the cells.
| TAT Test | Chronological Age | Sex | Estimated Biological Age | Difference with Chronological Age | Difference with last test | Median | 20th Percentile |
|---|---|---|---|---|---|---|---|
| Before | 69 | Female | 73 | +4 | – | 5.8Kb | |
| After | 69 | 64 | -5 | 9 years younger | – | 7.3Kb |
Male aged 71 years:
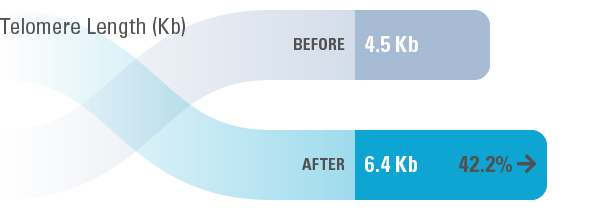
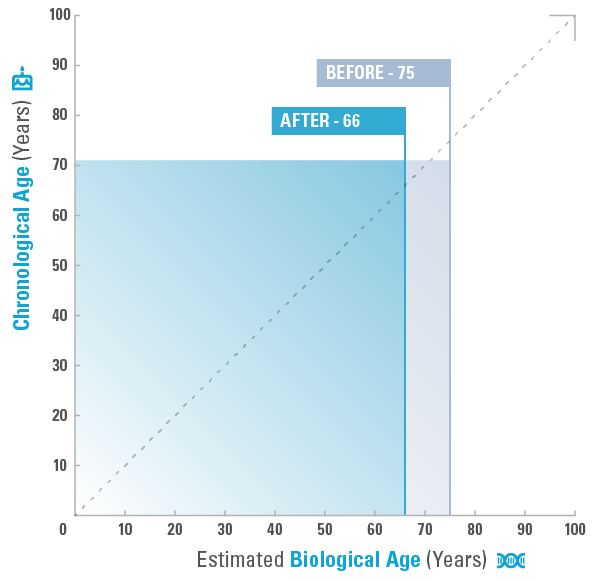
Test results before and after approx. 45 days show short telomere length increased by 42.2% and estimated biological age now 9 years younger.
The 20th percentile indicates the telomere length below which 20% of the observed telomeres fall. As such it is an estimator of the percentage of short telomeres in the cells.
| TAT Test | Chronological Age | Sex | Estimated Biological Age | Difference with Chronological Age | Difference with last test | Median | 20th Percentile |
|---|---|---|---|---|---|---|---|
| Before | 71 | Male | 75 | +4 | – | 4.5Kb | |
| After | 71 | 66 | -5 | 9 years younger | – | 6.4Kb |
Male aged 67 years:
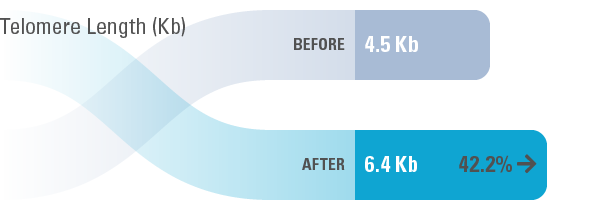
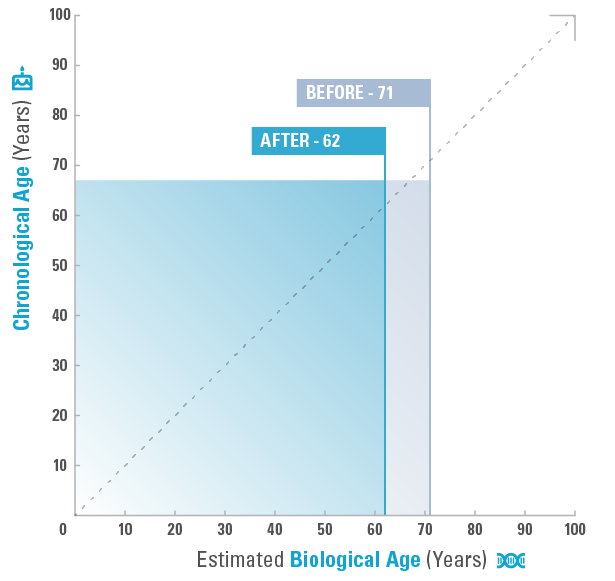
Test results before and after approx. 45 days show short telomere length increased by 42.2% and estimated biological age now 9 years younger.
The 20th percentile indicates the telomere length below which 20% of the observed telomeres fall. As such it is an estimator of the percentage of short telomeres in the cells.
| TAT Test | Chronological Age | Sex | Estimated Biological Age | Difference with Chronological Age | Difference with last test | Median | 20th Percentile |
|---|---|---|---|---|---|---|---|
| Before | 67 | Male | 71 | +4 | – | 4.5Kb | |
| After | 67 | 62 | -5 | 9 years younger | – | 6.4Kb |
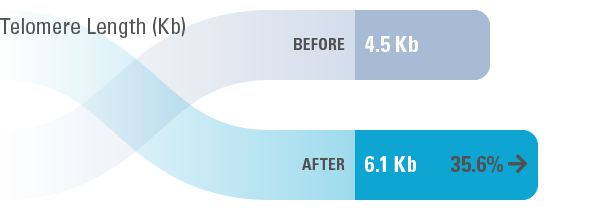
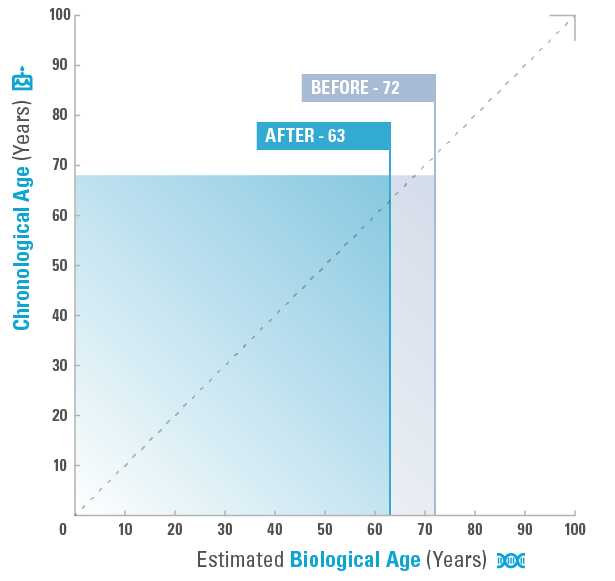
Male aged 68 years:
Test results before and after approx. 45 days show short telomere length increased by 35.6% and estimated biological age now 9 years younger.
The 20th percentile indicates the telomere length below which 20% of the observed telomeres fall. As such it is an estimator of the percentage of short telomeres in the cells.
| TAT Test | Chronological Age | Sex | Estimated Biological Age | Difference with Chronological Age | Difference with last test | Median | 20th Percentile |
|---|---|---|---|---|---|---|---|
| Before | 68 | Male | 72 | +4 | – | 4.5Kb | |
| After | 68 | 63 | -5 | 9 years younger | – | 6.1Kb |
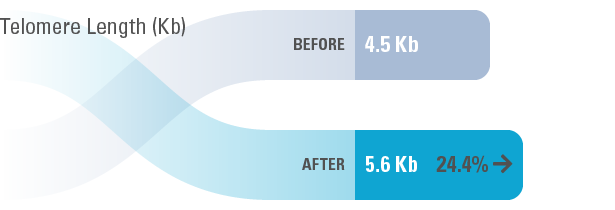
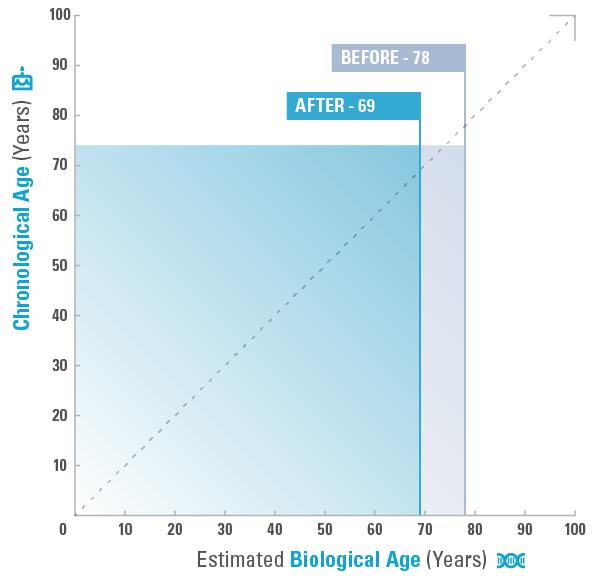
Male aged 74 years:
Test results before and after approx. 45 days show short telomere length increased by 24.4% and estimated biological age now 9 years younger.
The 20th percentile indicates the telomere length below which 20% of the observed telomeres fall. As such it is an estimator of the percentage of short telomeres in the cells.
| TAT Test | Chronological Age | Sex | Estimated Biological Age | Difference with Chronological Age | Difference with last test | Median | 20th Percentile |
|---|---|---|---|---|---|---|---|
| Before | 74 | Male | 78 | +4 | – | 4.5Kb | |
| After | 74 | 69 | -5 | 9 years younger | – | 5.6Kb |
Female aged 44 years:
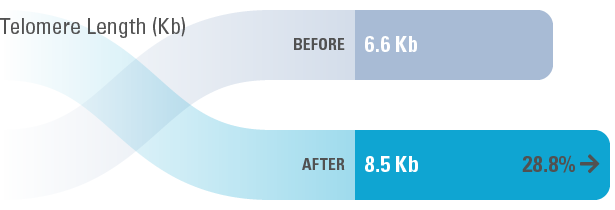
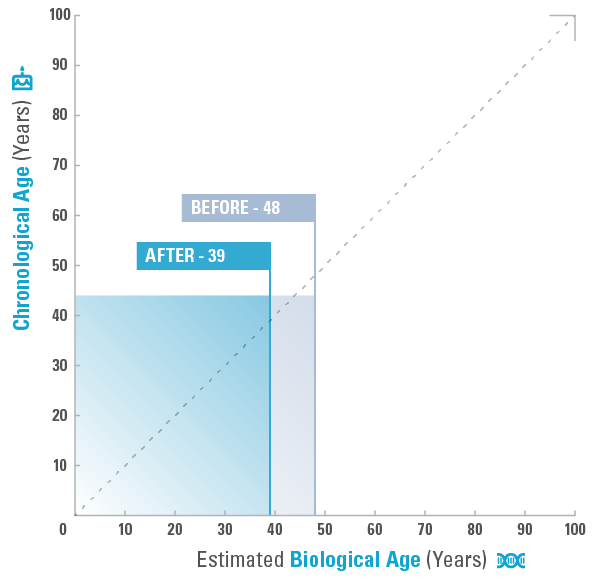
Test results before and after approx. 45 days show short telomere length increased by 28.8% and estimated biological age now 9 years younger.
The 20th percentile indicates the telomere length below which 20% of the observed telomeres fall. As such it is an estimator of the percentage of short telomeres in the cells.
| TAT Test | Chronological Age | Sex | Estimated Biological Age | Difference with Chronological Age | Difference with last test | Median | 20th Percentile |
|---|---|---|---|---|---|---|---|
| Before | 44 | Female | 48 | +4 | – | 6.6Kb | |
| After | 44 | 39 | -5 | 9 years younger | – | 8.5Kb |
Female aged 49 years:
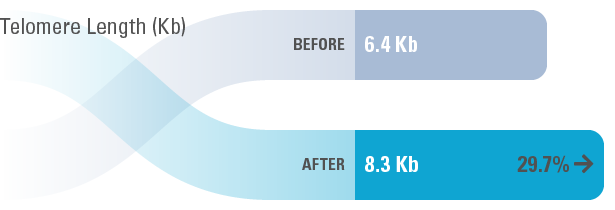
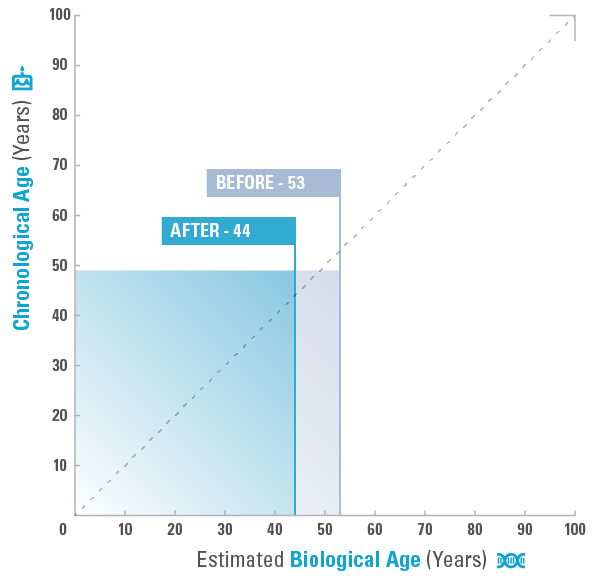
Test results before and after approx. 45 days show short telomere length increased by 29.7% and estimated biological age now 9 years younger.
The 20th percentile indicates the telomere length below which 20% of the observed telomeres fall. As such it is an estimator of the percentage of short telomeres in the cells.
| TAT Test | Chronological Age | Sex | Estimated Biological Age | Difference with Chronological Age | Difference with last test | Median | 20th Percentile |
|---|---|---|---|---|---|---|---|
| Before | 49 | Female | 53 | +4 | – | 6.4Kb | |
| After | 49 | 44 | -5 | 9 years younger | – | 8.3Kb |
Female aged 61 years:
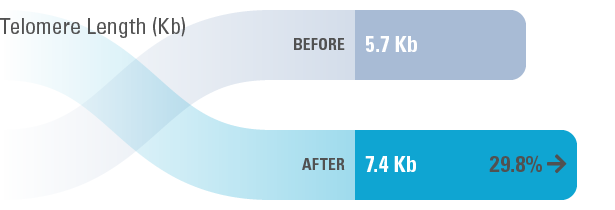
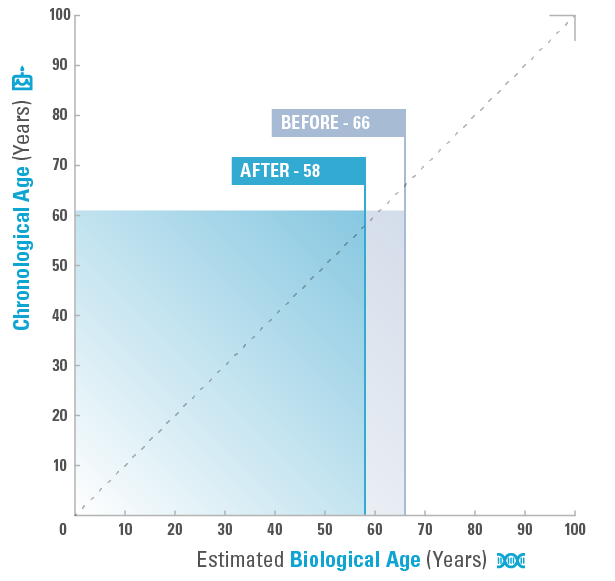
Test results before and after approx. 45 days show short telomere length increased by 29.8% and estimated biological age now 8 years younger.
The 20th percentile indicates the telomere length below which 20% of the observed telomeres fall. As such it is an estimator of the percentage of short telomeres in the cells.
| TAT Test | Chronological Age | Sex | Estimated Biological Age | Difference with Chronological Age | Difference with last test | Median | 20th Percentile |
|---|---|---|---|---|---|---|---|
| Before | 61 | Female | 66 | +5 | – | 5.7Kb | |
| After | 61 | 58 | -3 | 8 years younger | – | 7.4Kb |
Male aged 50 years:
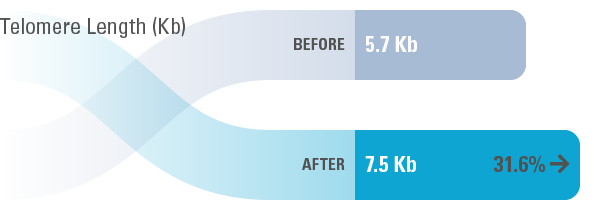
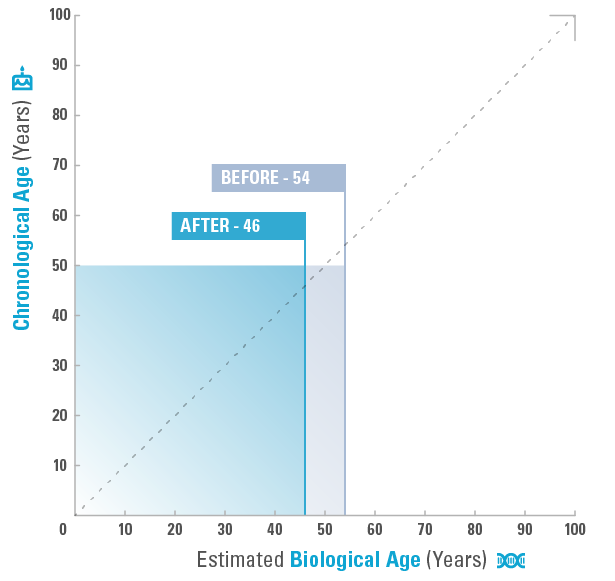
Test results before and after approx. 45 days show short telomere length increased by 31.6% and estimated biological age now 8 years younger.
The 20th percentile indicates the telomere length below which 20% of the observed telomeres fall. As such it is an estimator of the percentage of short telomeres in the cells.
| TAT Test | Chronological Age | Sex | Estimated Biological Age | Difference with Chronological Age | Difference with last test | Median | 20th Percentile |
|---|---|---|---|---|---|---|---|
| Before | 50 | Male | 54 | +4 | – | 5.7Kb | |
| After | 50 | 46 | -4 | 8 years younger | – | 7.5Kb |
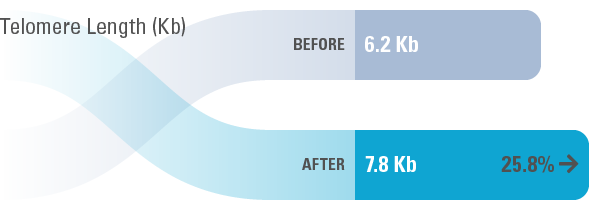
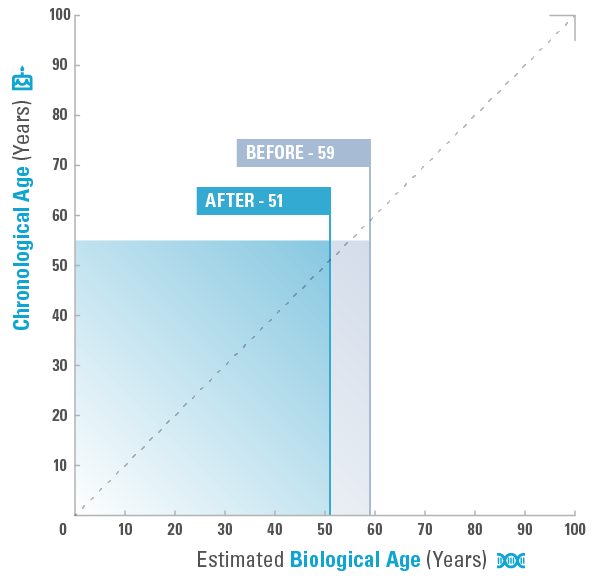
Female aged 55 years:
Test results before and after approx. 45 days show short telomere length increased by 25.8% and estimated biological age now 8 years younger.
The 20th percentile indicates the telomere length below which 20% of the observed telomeres fall. As such it is an estimator of the percentage of short telomeres in the cells.
| TAT Test | Chronological Age | Sex | Estimated Biological Age | Difference with Chronological Age | Difference with last test | Median | 20th Percentile |
|---|---|---|---|---|---|---|---|
| Before | 55 | Female | 59 | +4 | – | 6.2Kb | |
| After | 55 | 51 | -4 | 8 years younger | – | 7.8Kb |
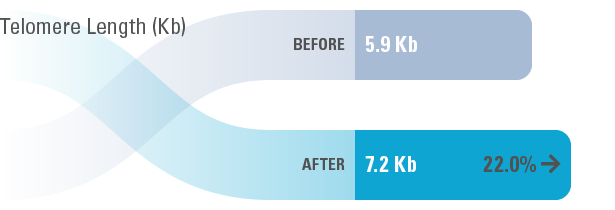
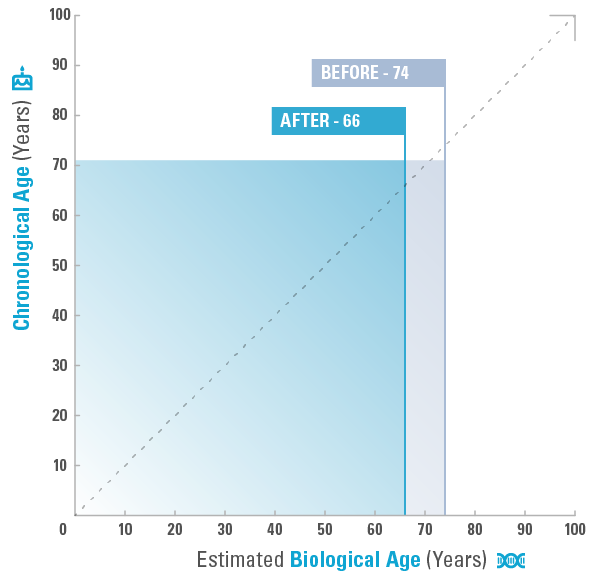
Female aged 71 years:
Test results before and after approx. 45 days show short telomere length increased by 22% and estimated biological age now 8 years younger.
The 20th percentile indicates the telomere length below which 20% of the observed telomeres fall. As such it is an estimator of the percentage of short telomeres in the cells.
| TAT Test | Chronological Age | Sex | Estimated Biological Age | Difference with Chronological Age | Difference with last test | Median | 20th Percentile |
|---|---|---|---|---|---|---|---|
| Before | 71 | Female | 74 | +3 | – | 5.9Kb | |
| After | 71 | 66 | -5 | 8 years younger | – | 7.2Kb |
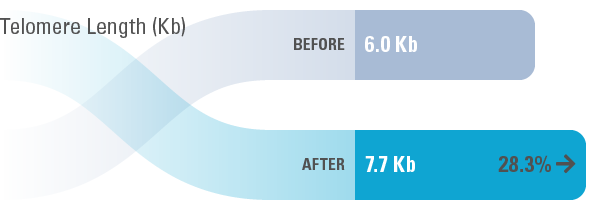
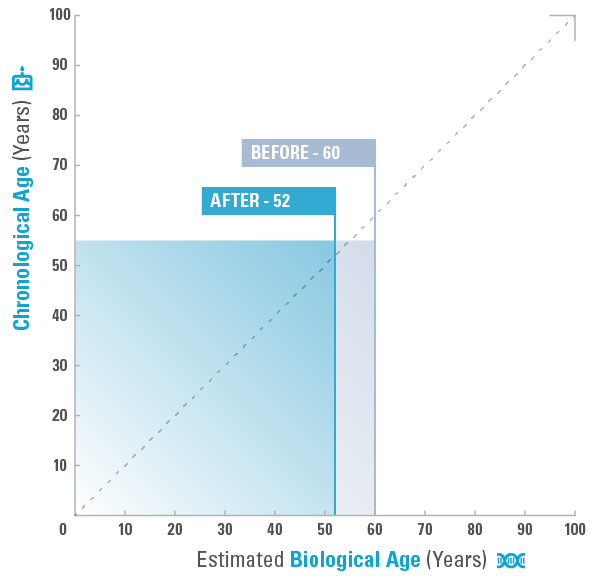
Female aged 55 years:
Test results before and after approx. 45 days show short telomere length increased by 28.3% and estimated biological age now 8 years younger.
The 20th percentile indicates the telomere length below which 20% of the observed telomeres fall. As such it is an estimator of the percentage of short telomeres in the cells.
| TAT Test | Chronological Age | Sex | Estimated Biological Age | Difference with Chronological Age | Difference with last test | Median | 20th Percentile |
|---|---|---|---|---|---|---|---|
| Before | 55 | Female | 60 | +5 | – | 6.0Kb | |
| After | 55 | 52 | -3 | 8 years younger | – | 7.7Kb |
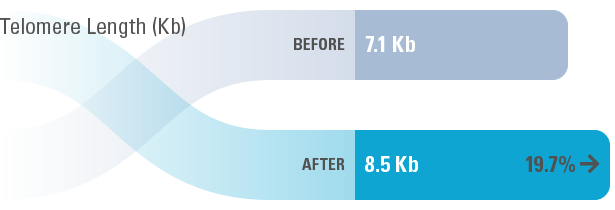
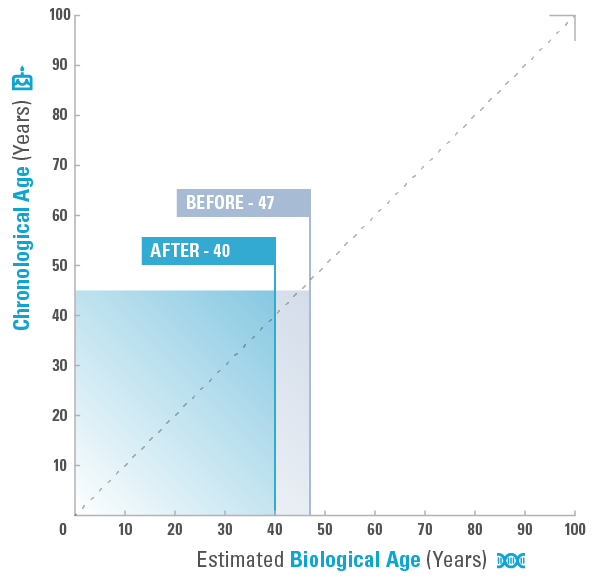
Female aged 45 years:
Test results before and after approx. 45 days show short telomere length increased by 19.7% and estimated biological age now 7 years younger.
The 20th percentile indicates the telomere length below which 20% of the observed telomeres fall. As such it is an estimator of the percentage of short telomeres in the cells.
| TAT Test | Chronological Age | Sex | Estimated Biological Age | Difference with Chronological Age | Difference with last test | Median | 20th Percentile |
|---|---|---|---|---|---|---|---|
| Before | 45 | Female | 47 | +2 | – | 7.1Kb | |
| After | 45 | 40 | -5 | 7 years younger | – | 8.5Kb |
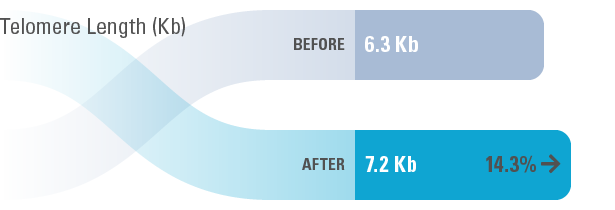
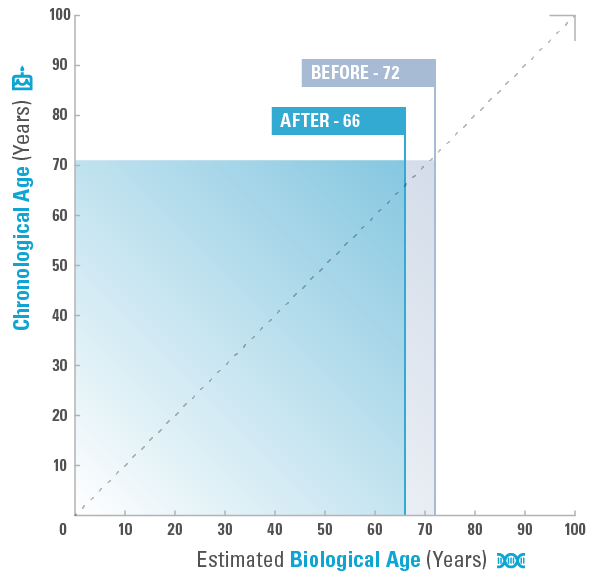
Female aged 71 years:
Test results before and after approx. 45 days show short telomere length increased by 14.3% and estimated biological age now 6 years younger.
The 20th percentile indicates the telomere length below which 20% of the observed telomeres fall. As such it is an estimator of the percentage of short telomeres in the cells.
| TAT Test | Chronological Age | Sex | Estimated Biological Age | Difference with Chronological Age | Difference with last test | Median | 20th Percentile |
|---|---|---|---|---|---|---|---|
| Before | 71 | Female | 72 | +1 | – | 6.3Kb | |
| After | 71 | 66 | -5 | 6 years younger | – | 7.2Kb |
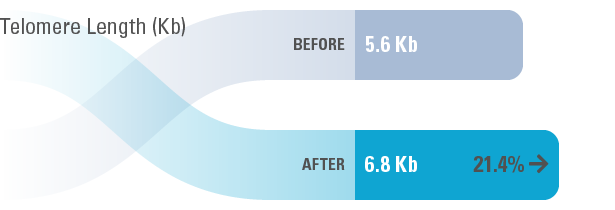
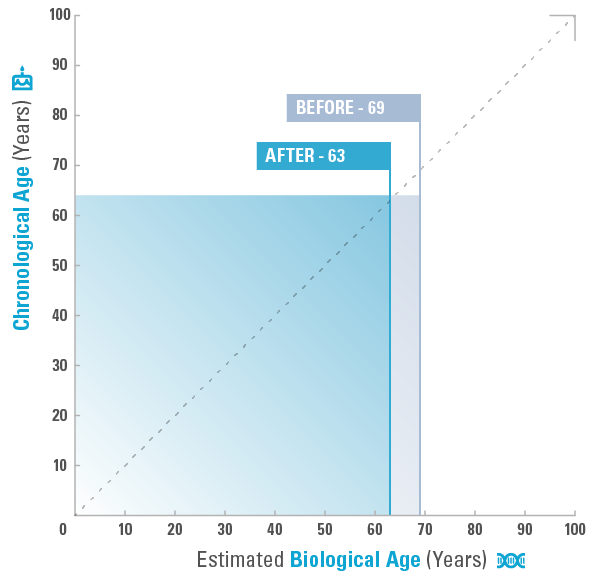
Female aged 64 years:
Test results before and after approx. 45 days show short telomere length increased by 21.4% and estimated biological age now 6 years younger.
The 20th percentile indicates the telomere length below which 20% of the observed telomeres fall. As such it is an estimator of the percentage of short telomeres in the cells.
| TAT Test | Chronological Age | Sex | Estimated Biological Age | Difference with Chronological Age | Difference with last test | Median | 20th Percentile |
|---|---|---|---|---|---|---|---|
| Before | 64 | Female | 69 | +5 | – | 5.6Kb | |
| After | 64 | 63 | -1 | 6 years younger | – | 6.8Kb |
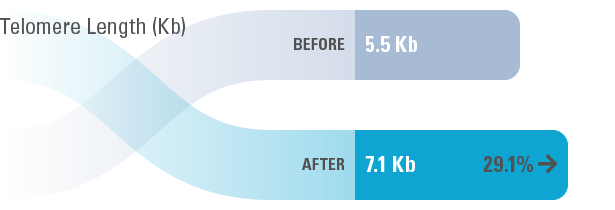
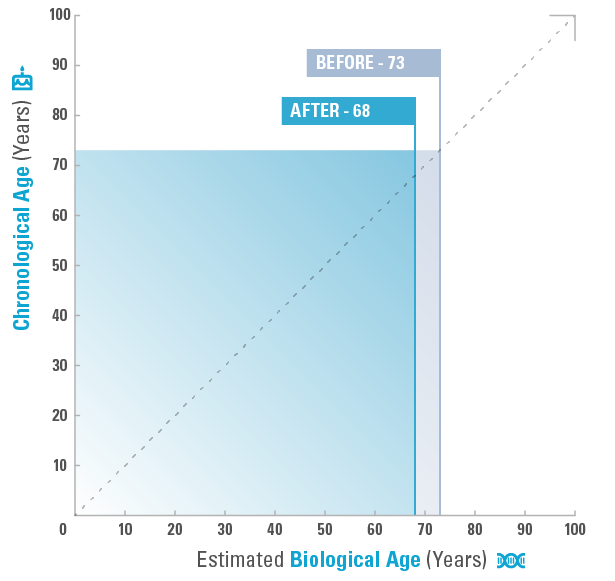
Male aged 73 years:
Test results before and after approx. 45 days show short telomere length increased by 29.1% and estimated biological age now 5 years younger.
The 20th percentile indicates the telomere length below which 20% of the observed telomeres fall. As such it is an estimator of the percentage of short telomeres in the cells.
| TAT Test | Chronological Age | Sex | Estimated Biological Age | Difference with Chronological Age | Difference with last test | Median | 20th Percentile |
|---|---|---|---|---|---|---|---|
| Before | 73 | Male | 73 | +0 | – | 5.5Kb | |
| After | 73 | 68 | -5 | 5 years younger | – | 7.1Kb |
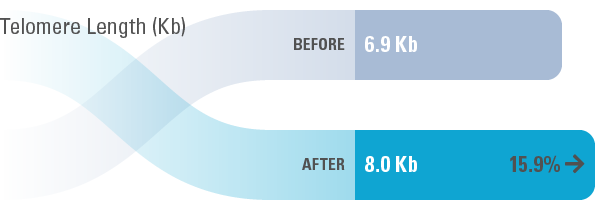
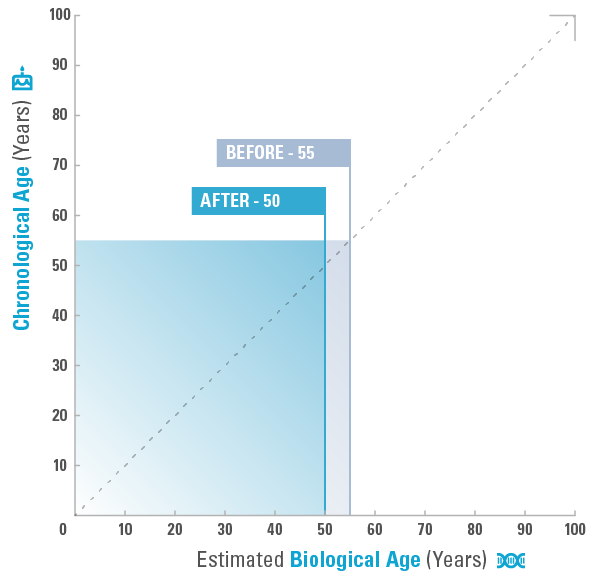
Female aged 55 years:
Test results before and after approx. 45 days show short telomere length increased by 15.9% and estimated biological age now 5 years younger.
The 20th percentile indicates the telomere length below which 20% of the observed telomeres fall. As such it is an estimator of the percentage of short telomeres in the cells.
| TAT Test | Chronological Age | Sex | Estimated Biological Age | Difference with Chronological Age | Difference with last test | Median | 20th Percentile |
|---|---|---|---|---|---|---|---|
| Before | 55 | Female | 55 | +0 | – | 6.9Kb | |
| After | 55 | 50 | -5 | 5 years younger | – | 8.0Kb |
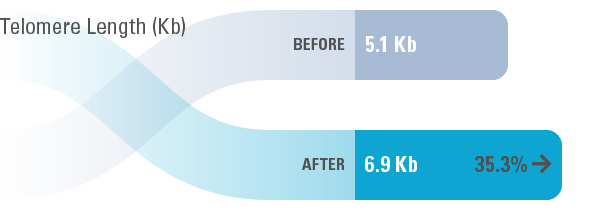
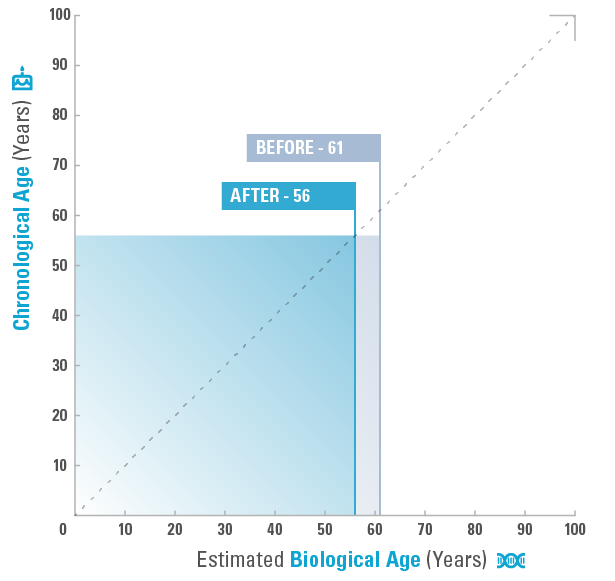
Male aged 56 years:
Test results before and after approx. 45 days show short telomere length increased by 35.3% and estimated biological age now 5 years younger.
The 20th percentile indicates the telomere length below which 20% of the observed telomeres fall. As such it is an estimator of the percentage of short telomeres in the cells.
| TAT Test | Chronological Age | Sex | Estimated Biological Age | Difference with Chronological Age | Difference with last test | Median | 20th Percentile |
|---|---|---|---|---|---|---|---|
| Before | 56 | Male | 61 | +5 | – | 5.1Kb | |
| After | 56 | 56 | -0 | 5 years younger | – | 6.9Kb |
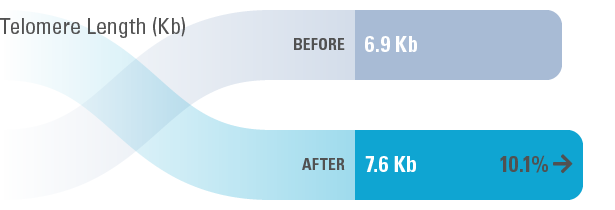
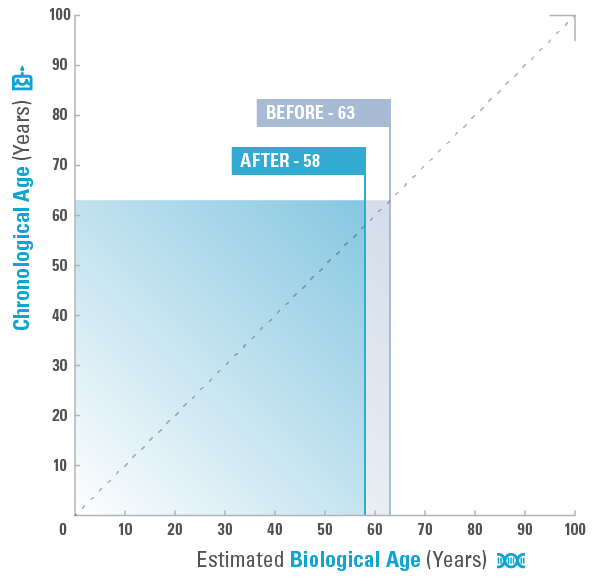
Female aged 63 years:
Test results before and after approx. 45 days show short telomere length increased by 10.1% and estimated biological age now 5 years younger.
The 20th percentile indicates the telomere length below which 20% of the observed telomeres fall. As such it is an estimator of the percentage of short telomeres in the cells.
| TAT Test | Chronological Age | Sex | Estimated Biological Age | Difference with Chronological Age | Difference with last test | Median | 20th Percentile |
|---|---|---|---|---|---|---|---|
| Before | 63 | Female | 63 | +0 | – | 6.9Kb | |
| After | 63 | 58 | -5 | 5 years younger | – | 7.6Kb |
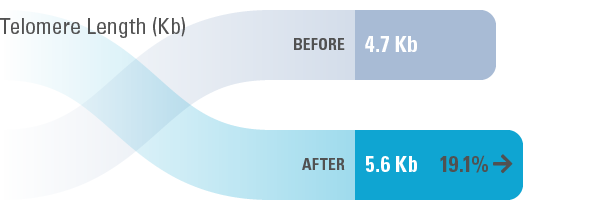
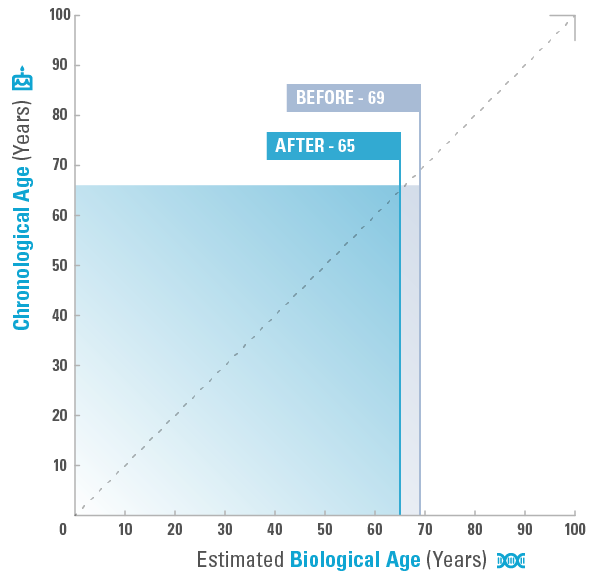
Male aged 66 years:
Test results before and after approx. 45 days show short telomere length increased by 19.1% and estimated biological age now 4 years younger.
The 20th percentile indicates the telomere length below which 20% of the observed telomeres fall. As such it is an estimator of the percentage of short telomeres in the cells.
| TAT Test | Chronological Age | Sex | Estimated Biological Age | Difference with Chronological Age | Difference with last test | Median | 20th Percentile |
|---|---|---|---|---|---|---|---|
| Before | 66 | Male | 69 | +3 | – | 4.7Kb | |
| After | 66 | 65 | -1 | 4 years younger | – | 5.6Kb |
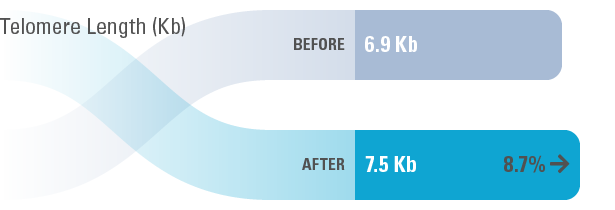
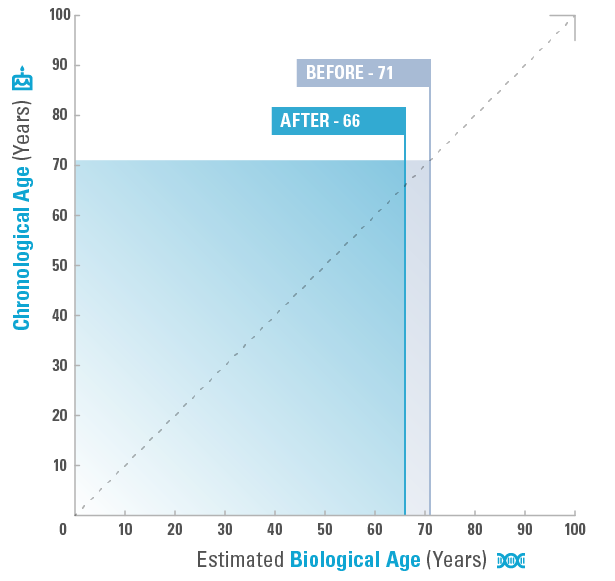
Female aged 71 years:
Test results before and after approx. 45 days show short telomere length increased by 8.7% and estimated biological age now 5 years younger.
The 20th percentile indicates the telomere length below which 20% of the observed telomeres fall. As such it is an estimator of the percentage of short telomeres in the cells.
| TAT Test | Chronological Age | Sex | Estimated Biological Age | Difference with Chronological Age | Difference with last test | Median | 20th Percentile |
|---|---|---|---|---|---|---|---|
| Before | 71 | Female | 71 | +0 | – | 6.9Kb | |
| After | 71 | 66 | -5 | 5 years younger | – | 7.5Kb |
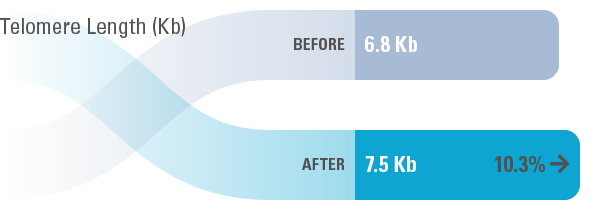
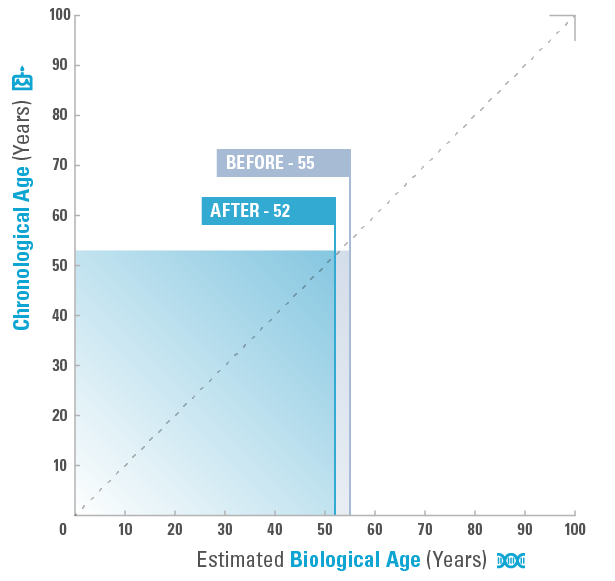
Female aged 53 years:
Test results before and after approx. 45 days show short telomere length increased by 10.3% and estimated biological age now 3 years younger.
The 20th percentile indicates the telomere length below which 20% of the observed telomeres fall. As such it is an estimator of the percentage of short telomeres in the cells.
| TAT Test | Chronological Age | Sex | Estimated Biological Age | Difference with Chronological Age | Difference with last test | Median | 20th Percentile |
|---|---|---|---|---|---|---|---|
| Before | 53 | Female | 55 | +2 | – | 6.8Kb | |
| After | 53 | 52 | -1 | 3 years younger | – | 7.5Kb |
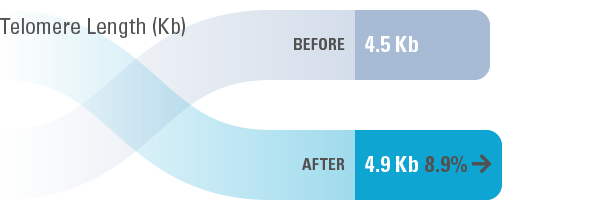
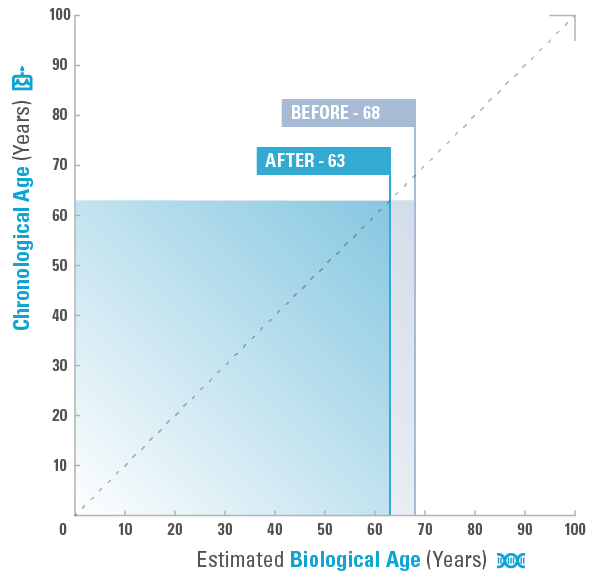
Male aged 63 years:
Test results before and after approx. 45 days show short telomere length increased by 8.9% and estimated biological age now 5 years younger.
The 20th percentile indicates the telomere length below which 20% of the observed telomeres fall. As such it is an estimator of the percentage of short telomeres in the cells.
| TAT Test | Chronological Age | Sex | Estimated Biological Age | Difference with Chronological Age | Difference with last test | Median | 20th Percentile |
|---|---|---|---|---|---|---|---|
| Before | 63 | Male | 68 | +5 | – | 4.5Kb | |
| After | 63 | 63 | -0 | 5 years younger | – | 4.9Kb |
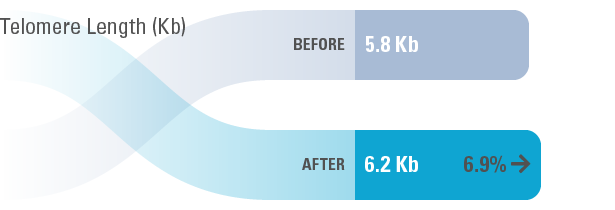
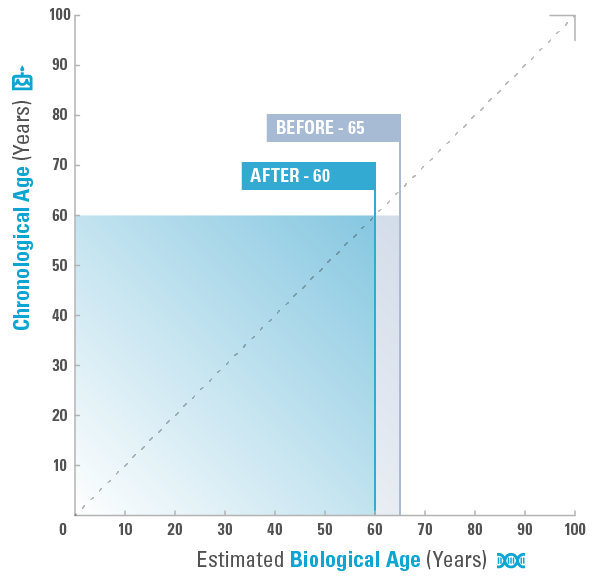
Female aged 60 years:
Test results before and after approx. 45 days show short telomere length increased by 6.9% and estimated biological age now 5 years younger.
The 20th percentile indicates the telomere length below which 20% of the observed telomeres fall. As such it is an estimator of the percentage of short telomeres in the cells.
| TAT Test | Chronological Age | Sex | Estimated Biological Age | Difference with Chronological Age | Difference with last test | Median | 20th Percentile |
|---|---|---|---|---|---|---|---|
| Before | 60 | Female | 65 | +5 | – | 5.8Kb | |
| After | 60 | 60 | -0 | 5 years younger | – | 6.2Kb |
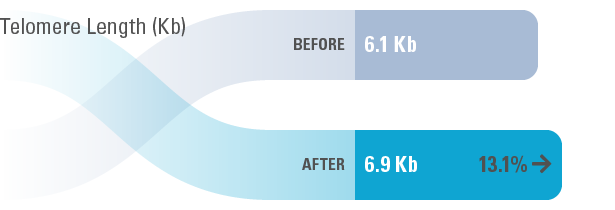
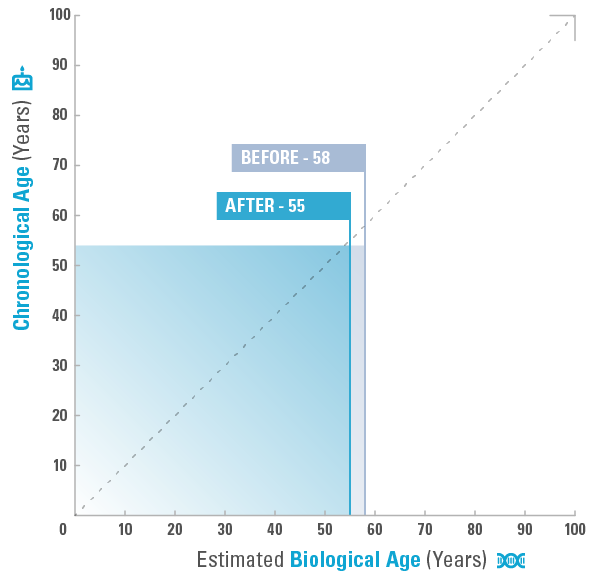
Female aged 54 years:
Test results before and after approx. 45 days show short telomere length increased by 13.1% and estimated biological age now 3 years younger.
The 20th percentile indicates the telomere length below which 20% of the observed telomeres fall. As such it is an estimator of the percentage of short telomeres in the cells.
| TAT Test | Chronological Age | Sex | Estimated Biological Age | Difference with Chronological Age | Difference with last test | Median | 20th Percentile |
|---|---|---|---|---|---|---|---|
| Before | 54 | Female | 58 | +4 | – | 6.1Kb | |
| After | 54 | 55 | +1 | 3 years younger | – | 6.9Kb |
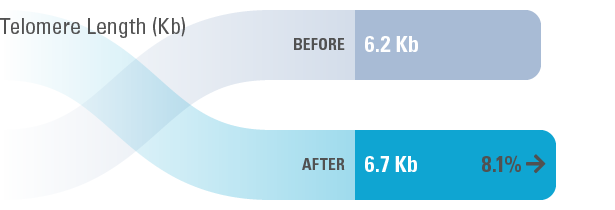
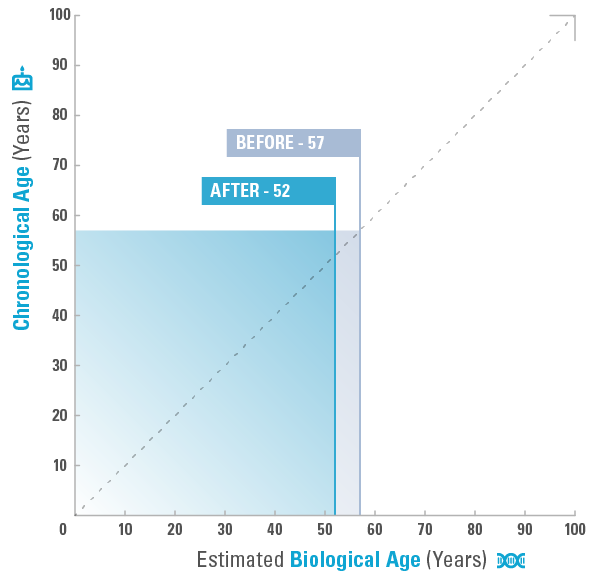
Male aged 57 years:
Test results before and after approx. 45 days show short telomere length increased by 8.1% and estimated biological age now 5 years younger.
The 20th percentile indicates the telomere length below which 20% of the observed telomeres fall. As such it is an estimator of the percentage of short telomeres in the cells.
| TAT Test | Chronological Age | Sex | Estimated Biological Age | Difference with Chronological Age | Difference with last test | Median | 20th Percentile |
|---|---|---|---|---|---|---|---|
| Before | 57 | Male | 57 | +0 | – | 6.2Kb | |
| After | 57 | 52 | -5 | 5 years younger | – | 6.7Kb |
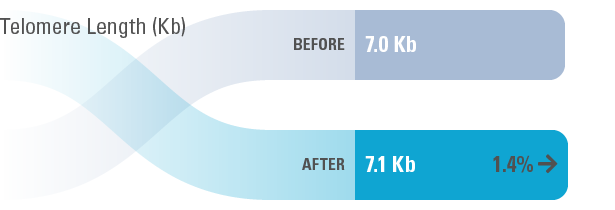
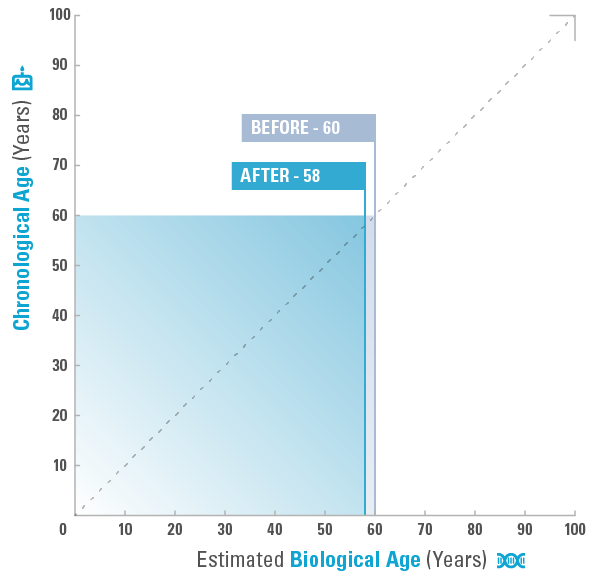
Female aged 60 years:
Test results before and after approx. 45 days show short telomere length increased by 1.4% and estimated biological age now 2 years younger.
The 20th percentile indicates the telomere length below which 20% of the observed telomeres fall. As such it is an estimator of the percentage of short telomeres in the cells.
| TAT Test | Chronological Age | Sex | Estimated Biological Age | Difference with Chronological Age | Difference with last test | Median | 20th Percentile |
|---|---|---|---|---|---|---|---|
| Before | 60 | Female | 60 | +0 | – | 7Kb | |
| After | 60 | 58 | -2 | 2 years younger | – | 7.1Kb |
